
Quantifying PEM Hydrogen Fuel Cell Efficiency with Real-Time Mass Flow Data

Acknowledgements
What Faraday’s law can’t tell you about PEM fuel cell efficiency
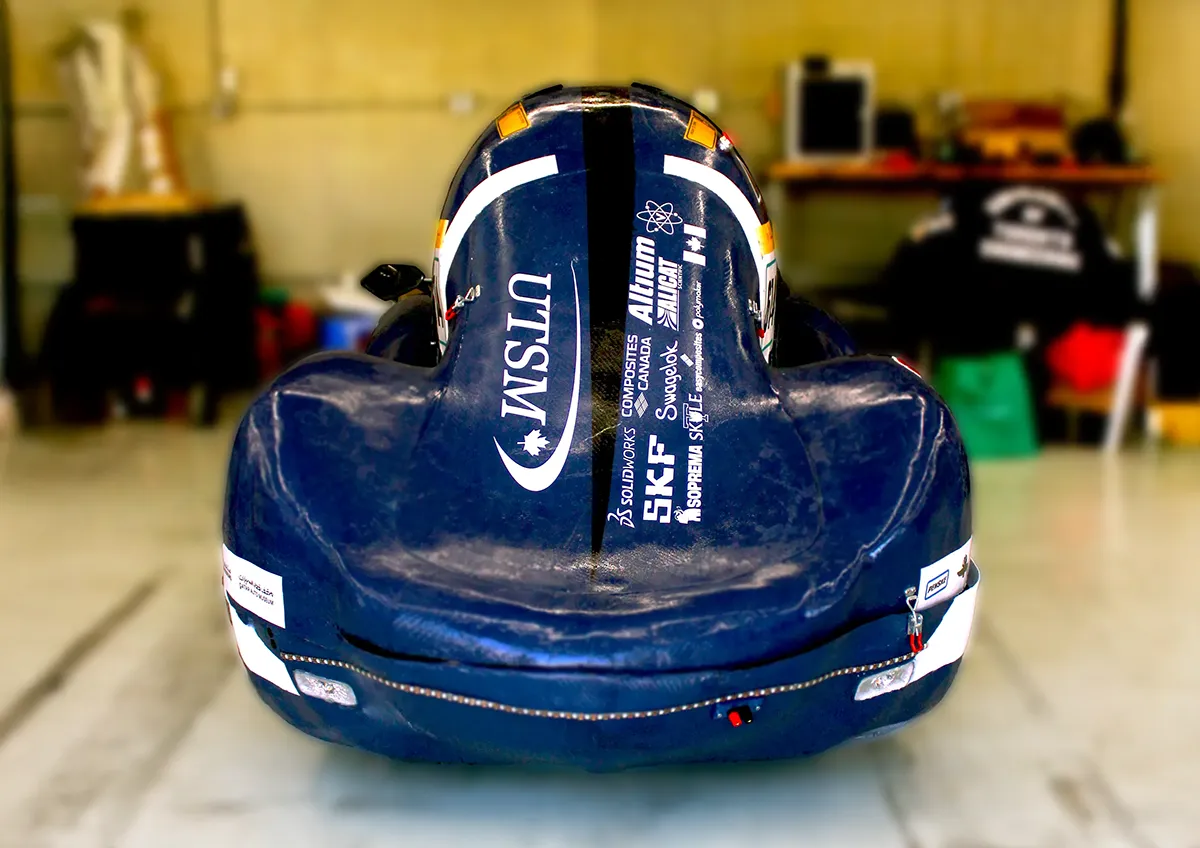
The University of Toronto Supermileage Team competes annually in the Shell Eco-Marathon Americas, where vehicles are judged on one metric: how efficiently they complete a 16-kilometer course. Their Urban Concept entry runs on hydrogen, powered by a proton exchange membrane (PEM) fuel cell that converts hydrogen gas into the electricity driving the vehicle forward. To compete at the front of the field, the team needed to know not just how much power their fuel cell was producing, but precisely how much hydrogen it was consuming to produce it.
Challenge
The gap in the data
Without hydrogen flow data, UTSM could track electrical output but could not calculate true efficiency, account for hydrogen lost during the fuel cell’s automatic purge cycle, or detect performance degradation between test sessions. Prior attempts to estimate hydrogen consumption using Faraday’s law fell short: the method relies on theoretical assumptions that do not reflect real operating conditions, and it cannot capture hydrogen vented during purging. A rotameter was also evaluated and ruled out due to poor accuracy and the absence of digital datalogging capability.
“Assessing hydrogen consumption at different loads allows us to optimize our racing strategy and the design of our propulsion system.”
— University of Toronto Supermileage Team, Urban Concept Powertrain Division
Selection
Selecting the Alicat mass flow controller
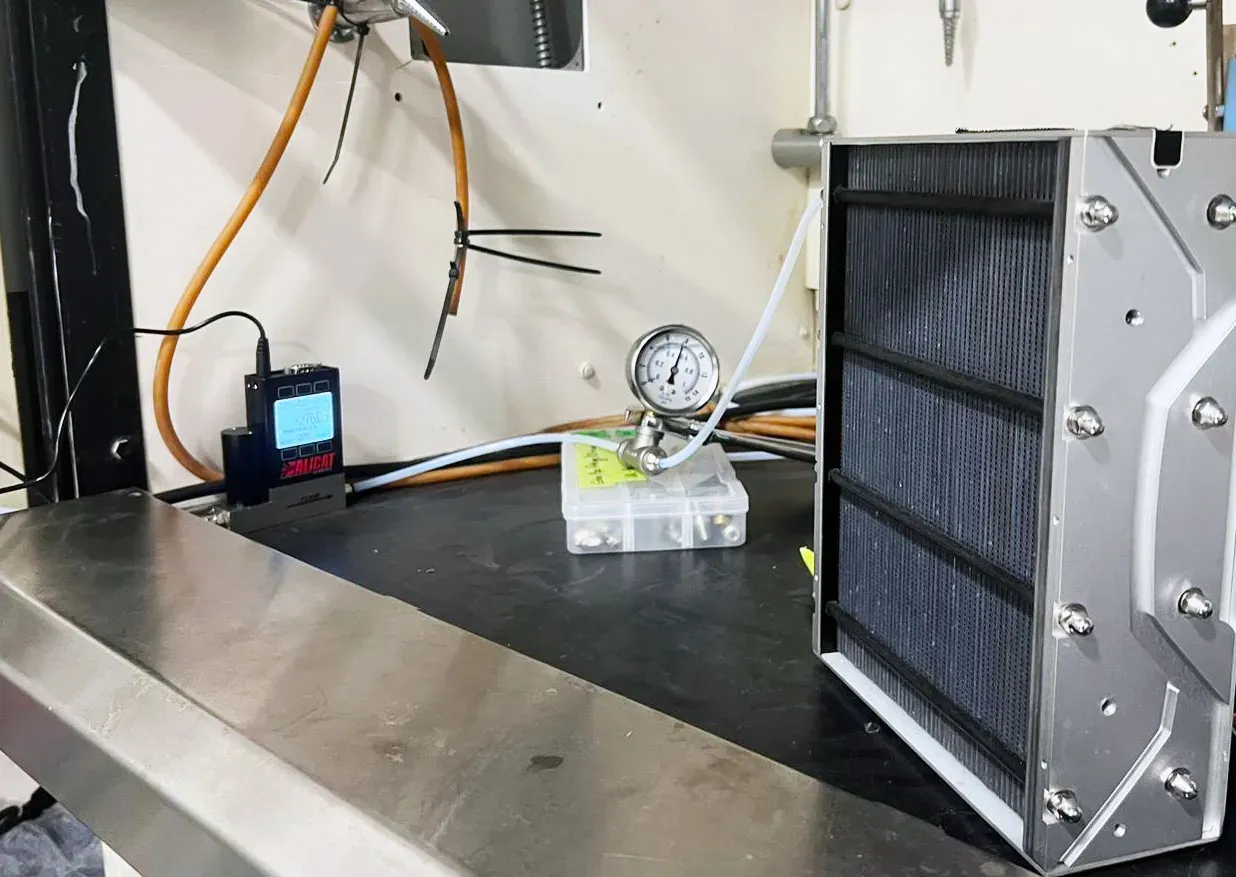
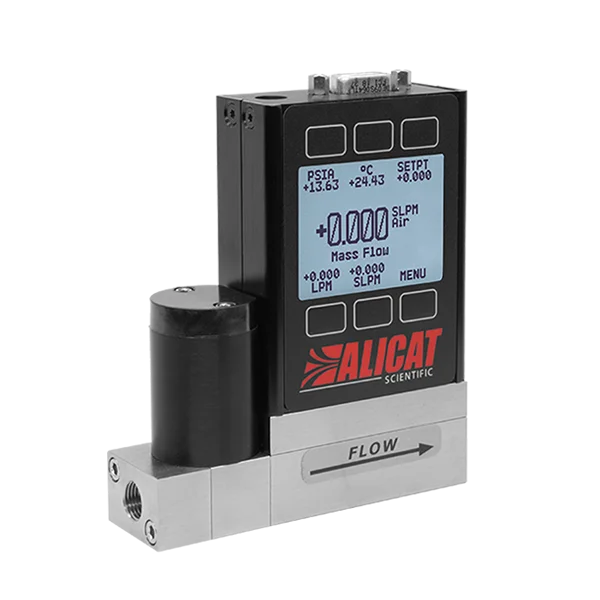
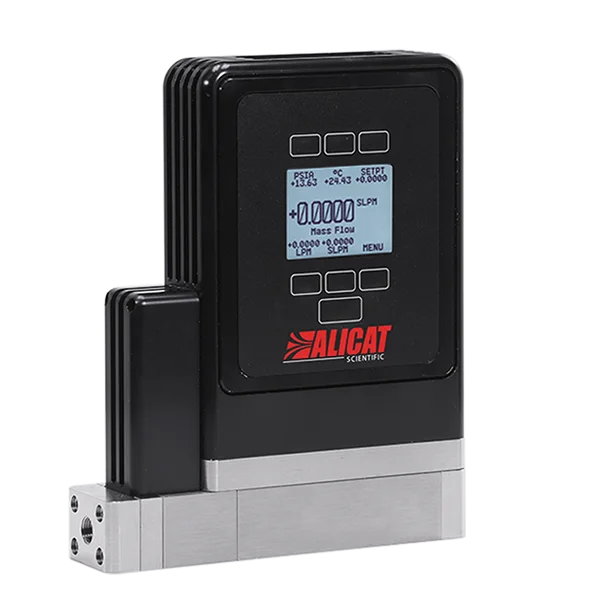
UTSM instrumented their test bench with an Alicat MC Series mass flow controller, which uses laminar differential pressure (DP) sensing to measure mass flow, volumetric flow, temperature, and pressure simultaneously. A few characteristics of this technology suited the demands of fuel cell testing directly.
The controller’s wide turndown ratio meant a single instrument could cover the team’s entire test range without swapping hardware between current steps. As the fuel cell moved from 5.0 A to 19.2 A, hydrogen flow climbed from roughly 2 SLPM to over 7 SLPM; the same controller held accuracy across that span.
Control response as fast as 30 ms also mattered for a test protocol built around discrete load steps. Each two-minute current step required the controller to settle quickly and hold a stable reading long enough for a reliable steady-state average; a slower-responding instrument would have introduced uncertainty into the early seconds of each step.
Built-in flow data including live flowrate, average flowrate, and a totalizer let the team capture cumulative hydrogen volume over each two-minute window directly, without separate calculation or post-processing. That totalized volume became the basis for the efficiency and utilization figures discussed below. Digital datalogging then allowed the team to store and compare results across monthly test sessions, something neither the rotameter nor the Faraday’s law estimate could offer.
The fuel cell was tested at five steady-state current steps from 5.0 A to 19.2 A using four 150 W load banks in constant current mode. Before each test, the stack was rehydrated at 488 W for one hour; open circuit voltage rising from 43.5 V to 46.1 V confirmed readiness. Pressure was held between 6 and 9 PSI throughout, comfortably within the controller’s operating range.
Outcomes
Efficiency across the operating curve
With totalized hydrogen volume measured at each operating point, the team could calculate efficiency directly by comparing electrical power output against hydrogen energy input. The results revealed a clear trend: efficiency decreases as current increases, falling from 42.56% at 5.0 A to 35.03% at 19.2 A. This decline follows the drop in stack voltage across the same range and reflects the losses that accumulate at higher current densities.
For Shell Eco-Marathon competition, the implication is direct: the fuel cell operates most efficiently at the lower end of its current range, so the optimal race strategy is to draw the minimum current needed to maintain the required vehicle speed.
Calculated Hydrogen Utilization Ratio for the Horizon H-1000
The Alicat totalizer also made it possible to calculate the stack’s hydrogen utilization ratio at each operating point, comparing actual measured flow against the theoretical consumption rate derived from output current. Utilization runs at approximately 90% at low current and rises to approximately 97% at higher current densities. The remaining hydrogen exits through the purge cycle — a figure that had been invisible before flow measurement was introduced.
Need more details?
Download the full whitepaper for the complete dataset, efficiency calculations, and utilization analysis.

Related products
References
- Alikakos, K., & Dawoodally, Z. (2026). Assessing proton exchange membrane hydrogen fuel cell performance with Alicat flowmeter to determine its practical efficiency. University of Toronto Supermileage Team. Reviewed by R. Perez Vicente.